
🟠 Continuous Observability
Gain Continuous Insight across your Embedded Development Lifecycle
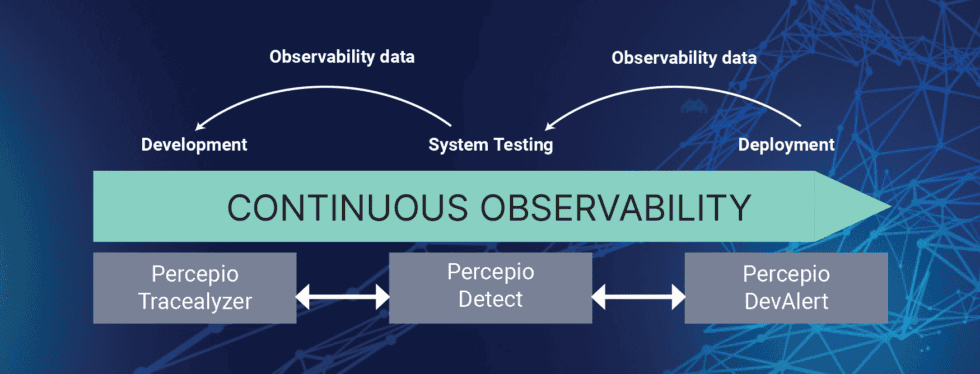
Continuous Observability creates an overarching feedback loop across integration, testing and operation — continuously feeding insights from the running system back into development.
Beyond Traditional Debugging and Verification
Traditional debugging and verification focus primarily on investigating specific problems and validating system behavior during active development.
Continuous Observability extends this perspective over time. It continuously provides insight into the behavior of embedded software throughout integration, testing and operation — helping development teams recognize changes, capture diagnostic evidence and feed what they learn from running systems back into development.
Continuous Observability shifts the focus from individual observation and analysis sessions to an ongoing feedback process.
This Is What Continuous Observability Does
Continuous Observability provides ongoing visibility into the behavior of embedded systems throughout development, integration, testing and operation. Developers continuously collect and analyze logs, events, metrics, and runtime data, detect anomalies and performance regressions, and trace issues back to their root cause. The insights gained are directly incorporated into development, debugging, and verification - resulting in more reliable and continuously improved embedded software.
Three Technologies – One Continuous Feedback Loop
Percepio's Continuous Observability approach combines three complementary technologies that provide insight at different points of the development and product lifecycle.
Tracealyzer — UNDERSTAND
Gain deep visual insight into runtime behavior and investigate complex interactions and root causes.
Detect — RECOGNIZE & CAPTURE
Continuously monitor embedded software for stability risks and capture diagnostic evidence when relevant problems occur.
DevAlert — FEEDBACK
Bring diagnostic information from remote testing and deployed devices back to the development organization.
Together, these technologies turn runtime information into an ongoing engineering feedback process:
Observe → Detect → Understand → Improve → Repeat
How the Continuous Observability Loop Works
Continuous Observability is an iterative process rather than a fixed sequence.
Typical activities within this feedback loop include:
1️⃣
Collect relevant system data
- Record logs, events, and error messages
- Collect system states and operating parameters
- Monitor CPU, memory, and resource usage
- Collect communication and interface data
2️⃣
Monitor runtime behavior
- Monitor tasks, interrupts, and events
- Analyze timing and response times
- Track state changes
- Identify deviations from expected behavior
3️⃣
Analyze metrics and trends
- Compare performance metrics over extended periods
- Monitor memory usage and system load
- Evaluate the frequency of specific errors or events
- Detect gradual performance degradation
4️⃣
Detect anomalies and errors
- Identify unusual system states
- Track down sporadic and hard-to-reproduce errors
- Detect threshold violations
- Automatically report relevant events
5️⃣
Trace problems back to their root cause
- Correlate logs, trace data, and metrics
- Reconstruct the timing and context of an error
- Investigate the relationship between software changes and system behavior
- Perform root cause analysis
6️⃣
Compare versions and releases
- Compare behavior before and after software changes
- Identify performance regressions
- Evaluate the impact of new features
- Consolidate results from CI/CD, tests, and real-world system operations
7️⃣
Feed insights back into development
- Incorporate anomalies as new development or debugging tasks
- Fix errors and implement optimizations
- Supplement tests based on observed real-world error cases
- Improve the next software version based on the insights gained
Services & Support
Evaluation Software
NEWSLETTER & Training
Update: October 3rd, 2026
© 2026 Carnica Technology. All Rights Reserved. Contact Us · Legal & Privacy