🟢 SEGGER SystemView
Enabling Analysis & Profiling of Embedded System Behavior
SEGGER SystemView provides real-time insight into the runtime behavior of embedded systems. It records and visualizes tasks, interrupts, software timers, API calls and user-defined events, helping developers understand how their application actually behaves on the target.
SystemView supports runtime analysis, profiling and design verification by making timing, task interaction, CPU load and system events visible. Recorded data can be analyzed live or saved for later analysis and documentation.
With SEGGER J-Link and Real Time Transfer (RTT), SystemView supports continuous real-time recording with minimal impact on the running target.
SystemView - Overview
SystemView records telemetry data generated by the embedded target and visualizes it in synchronized analysis windows. Developers can examine task execution, interrupts, software timers and system events together with detailed timing information.
Using J-Link and SEGGER Real Time Transfer (RTT), data can be continuously transferred from the running target to the host application for real-time analysis. Recordings can also be saved for later investigation or documentation.
This detailed runtime insight helps developers identify unexpected task interactions, timing problems, unnecessary interrupts, resource conflicts and performance limitations — and verify whether the system behaves as intended.
On which CPUs can SystemView be Used?
SystemView is designed to work across a wide range of embedded target systems. Continuous real-time recording is available on targets that support SEGGER's Real Time Transfer (RTT) technology.
For systems where continuous RTT recording is not available, SystemView also supports alternative recording methods such as single-shot and post-mortem analysis.
How much work is it to add it to a Target System?
Integrating SystemView requires only a small number of target-side files. With supported operating systems, only minimal application changes are typically required. Other systems can be instrumented by adding SystemView event calls for the activities that need to be monitored.
The exact integration effort depends on the target system, RTOS and required level of instrumentation.
How does SystemView work?
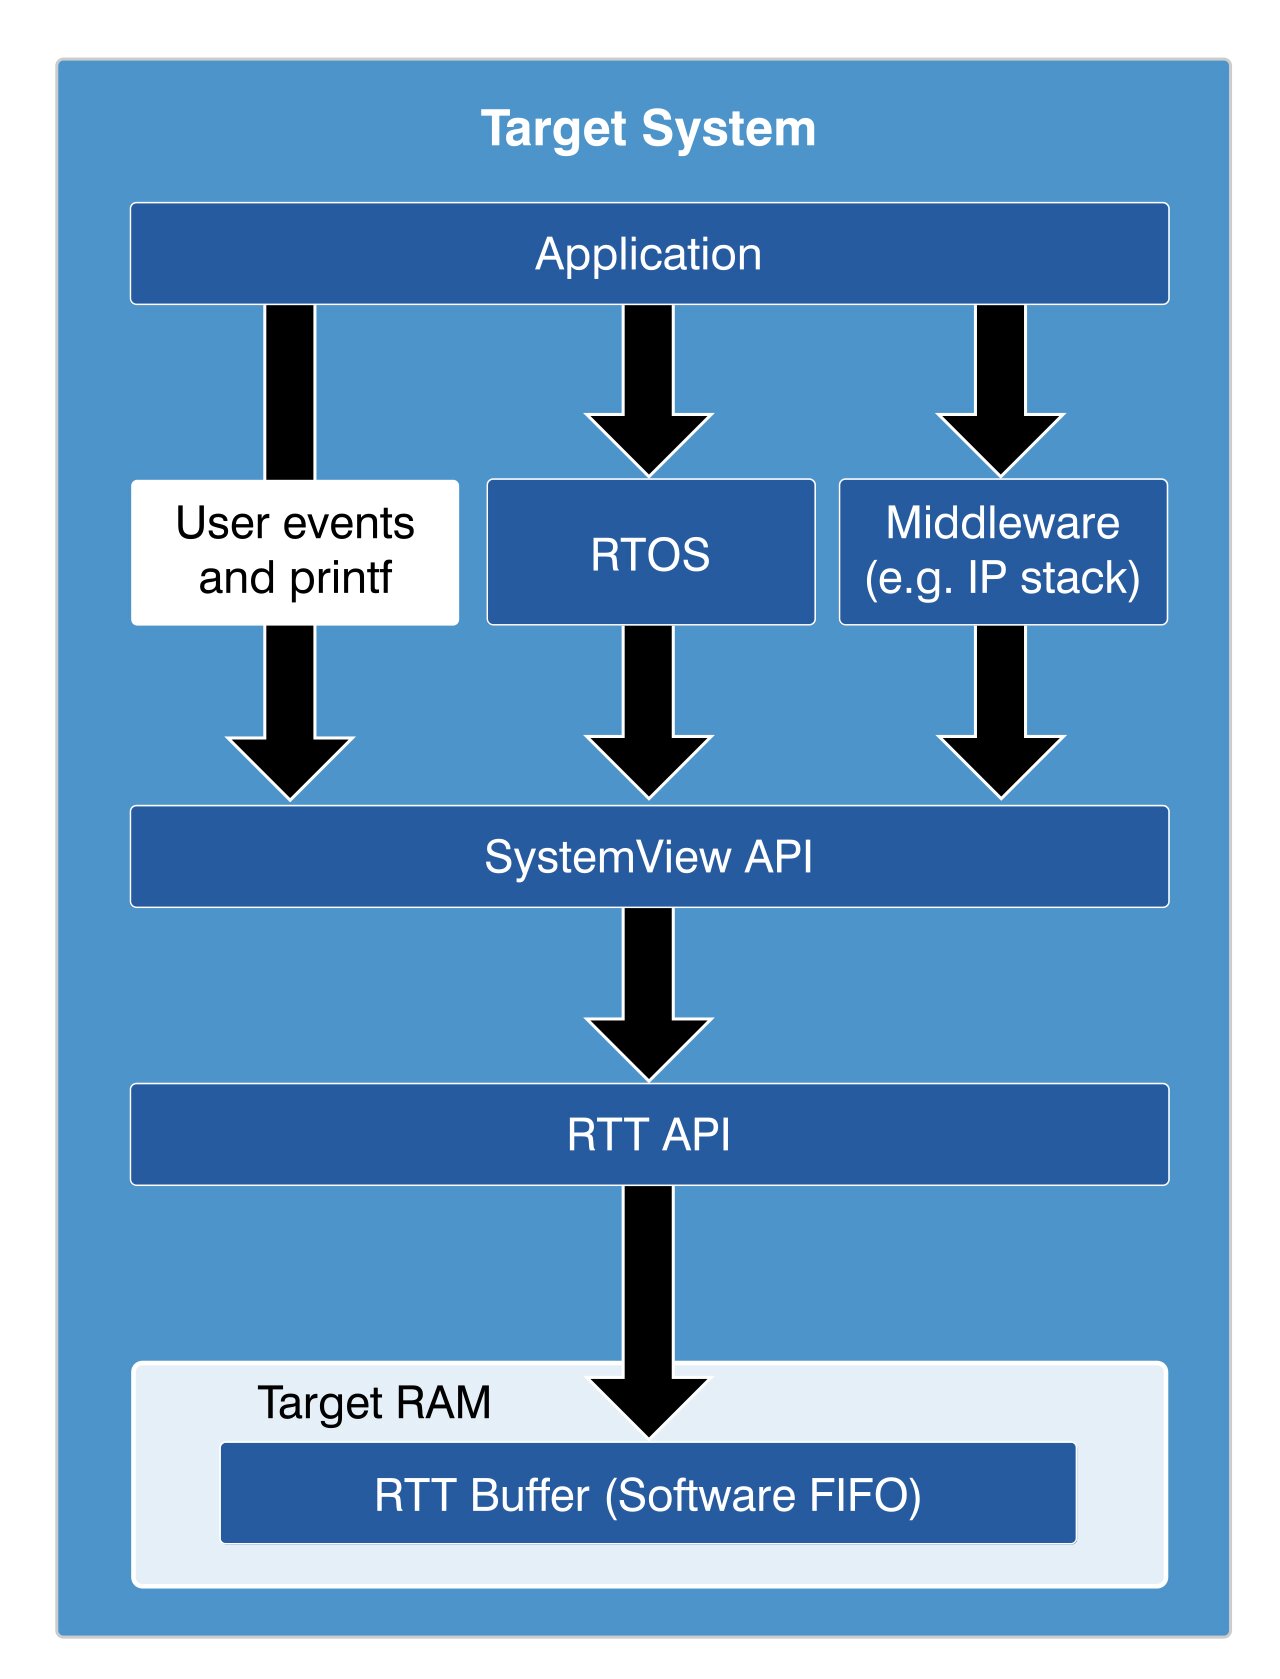
On the target side, SystemView collects runtime events and adds precise timing information. With SEGGER RTT, this data can be transferred through the debug interface to the SystemView host application while the target continues running.
The host application records, analyzes and visualizes the data in synchronized views, allowing developers to reconstruct system execution and examine runtime behavior in detail.
What Resources are required on the Target Side?
SystemView is designed for low-overhead runtime recording. The required target resources depend on the configuration, recording mode, RTOS and amount of recorded data.
When using RTT, runtime information is transferred through the existing debug interface, so no additional communication interface or dedicated target pins are normally required.
Continuous Recording
With a J-Link debug probe and the SEGGER Real Time Transfer technology (RTT), SystemView can continuously record target execution in real time, while the target is running. This enables the analysis of the system behavior over a longer period of time without requiring a large target memory buffer.
Single-Shot Recording
When the target device does not support RTT or when no J-Link is used, SystemView can still record data into its buffer until it is filled. Single-shot recording offers insight to the startup sequence or event-triggered activity in any system for a decent amount of time.
Post-Mortem Mode
Post-mortem analysis is similar to single-shot recording, with one difference: SystemView events are continuously recorded. When the target buffer is filled older events are overwritten and reading the buffer provides the latest recorded events. Post-mortem analysis can provide information of long-time system tests and help analyzing system crashes.
Services & Support
Evaluation Software
NEWSLETTER & Training
Update: October 3rd, 2026
© 2026 Carnica Technology. All Rights Reserved. Contact Us · Legal & Privacy